
Chapter 11 - Contour Maps and Landforms
Q.1. Answer the following questions.
(1) How can the distribution of the height and landforms in a region be shown?
Ans: The distribution of the height and landforms in a region be shown with the help of contour maps.
(2) To whom are the contour maps useful?
Ans: Contour maps are of immense use to mountaineers, trekkers, soldiers, defense officers, etc.
(3) What do you understand by observing contour lines?
Ans: Every contour line is drawn with the intervals between them, indicating each peak’s altitude above sea level. It also shows the coverage area of the peak or any other landform. Therefore, the contour lines help us observe the landforms and derive conclusions from them.
(4) How will a contour map be useful for a farmer?
Ans: Farmers depend on the land they cultivate. They should be aware of the natural structure of the landforms through contour maps. For example, farmers who cultivate using plantation farming must know the altitude and direction of the slope on which their plantation depends. Heavy rains will cause soil erosion in the hillside region. So plantation farmers shall be aware of such threats.
Q.2. Fill the blanks with appropriate words.
(1) If the contour lines are closer to each other, the slope is ……………
Ans: steep
(2) The contour lines on the map represent ……………
Ans: places of same altitude
(3) The slope can be understood from the distance between the ……………
Ans: contour lines
(4) If the distance between two contour lines is more, the …………… is gentle.
Ans: slope
Q.3. Identify the landforms in the following map.
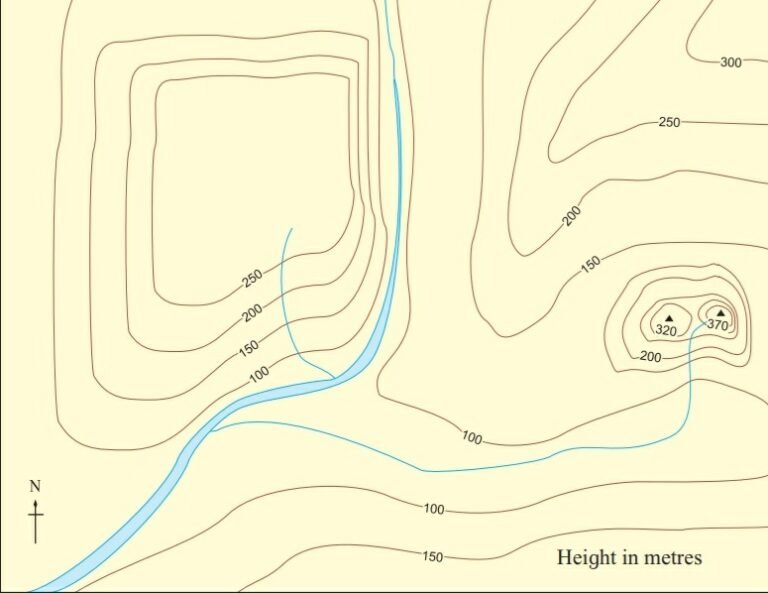
Ans: The landforms shown in the following map are;
1. Plains
2. Mountainous regions
3. Peak
4. Valley
5. Plateau