
Chapter 1 – Distributional Maps
Q 1. Give reasons why following sentences are right or wrong:
(1) The main aim of distributional maps is to show location.
Ans: Wrong
Reason:
The main aim of distributional maps is not just to show location but to represent the distribution of specific variables like temperature, rainfall, or population across a region. These thematic maps use different methods to visually display how such variables are spread in a particular area for better understanding and analysis.
(2) In choropleth maps, only one value is assigned to the sub-administrative unit.
Ans: Right
Reason:
In choropleth maps, only one value is assigned to each sub-administrative unit because data is classified into specific ranges and represented using different shades or patterns. Each shade indicates one class of data for a region. This method ensures clarity by visually showing only the dominant or average value for each unit, not multiple values.
(3) In choropleth maps, colours/tints do not change according to the values of the variables.
Ans: Wrong.
Reason: In choropleth maps, colours or tints change based on the values of a variable. The data is divided into 5–7 classes, from lowest to highest values. Each class is represented by a different shade of the same colour or pattern to show variation across sub-administrative units like districts or states.
(4) Choropleth maps are used to show altitudes.
Ans: Wrong.
Reason: Choropleth maps are not used to show altitudes. Isopleth maps are used instead, as they show continuous data like altitude using lines connecting equal values. Choropleth maps represent discontinuous data like population or livestock by using shaded areas. Hence, for altitude, isopleth maps are more appropriate and accurate.
(5) Isopleth maps are used to show population distribution.
Ans: Wrong.
Reason:
Isopleth maps show continuous data like temperature or altitude. Population distribution is discontinuous, so dot method or choropleth maps are used instead. These methods effectively represent how people are spread across an area, while isopleth maps are unsuitable for showing such non-continuous data.
(6) In dot method, every dot should have an appropriate scale.
Ans: Right.
Reason: In the dot method, each dot represents a specific value of a variable. To accurately reflect data, an appropriate scale must be chosen. This ensures the number and placement of dots correctly represent the distribution and quantity of the variable across the region, making the map meaningful and easy to interpret.
(7) Isopleth maps are not made using isolines.
Ans: Wrong.
Reason: Isopleth maps are indeed made using isolines. Isolines are lines that connect places with equal values of a particular variable, like temperature or rainfall. Since isopleth maps are drawn by joining such points of equal value, they are essentially based on isolines. Hence, the statement is incorrect.
(8) Distribution of various geographical elements can be shown using the dot method.
Ans: Wrong.
Reason: The dot method is used to show the distribution of scattered geographical elements like population, minerals, or cattle. It is not suitable for continuous elements such as rainfall, temperature, or altitude, which require methods like isopleths or choropleths for accurate representation. Hence, not all geographical elements can be shown using the dot method.
Q 2. Answer in brief.
(1) Explain the use and types of distributional maps.
Ans:
(a) Use of distributional maps:
Distributional maps are useful for explaining the patterns of distribution of a particular geographical variable.
(b) The following are the types of distributional maps:
(i) Dot Method: The distributional map based on statistical data made by this method makes use of dots of a pre-decided size to show the distribution of a particular variable.
For example: a dot method map is used to show the population of a region, the distribution of cattle, etc.
(ii) Choropleth Method: The distributional map made by this method makes use of shades or tints of various colors to show the distribution of a particular variable.
For example: a Choropleth method map is used to show population density, types of forest cover, and uses of land.
(iii) Isopleth Method: The distributional map made by this method makes use of lines joining locations or places having the same or equal values of a particular variable.
For example: An isopleth method map is used to show altitude, temperature, and rainfall.
(2) Differentiate between choropleth and isopleths methods.
Ans:
| Choropleth Method | Isopleth Method |
|---|---|
(1) In Choropleth method maps, the distribution of various variables is shown by shading or using tints of the same colour. |
(1) In Isopleth method maps, the distribution of various variables is shown with the help of isolines. |
(2) When the distribution of a variable is not continuous, the choropleth method is used. |
(2) When the distribution of a variable is continuous, the isopleth method is used. |
(3) The Choropleth method is used to show population density, cattle distribution, etc. |
(3) The isopleth method is used to show altitude, temperature, rainfall, etc. of a region. |
(3) Explain with reasons the method which is best suited to show the distribution of population in a region.
Ans:
(i) The dot method of making a distributional map is best suited to show the distribution of population in a region.
(ii) The dots used in this method are given a particular value, which is determined by selecting a proper scale considering the spread of the values of the variables in the given region.
(iii) This method is best suited to show the distribution of the variables that are freely scattered, as in the case of population distribution.
Q 3. Which method will you use for the following information ?
(1) Taluka Wise wheat production in the district
Ans: Dot method
(2) Distribution of the altitude of the land in the district.
Ans: Isopleth method
(3) Distribution of domestic animals in the State
Ans: Dot method
(4) The distribution of population density in India
Ans: Choropleth method
(5) Temperature distribution in Maharashtra State.
Ans: Isopleth method
Q 4. Study the population distribution map of Kolhapur district and answer the following questions:
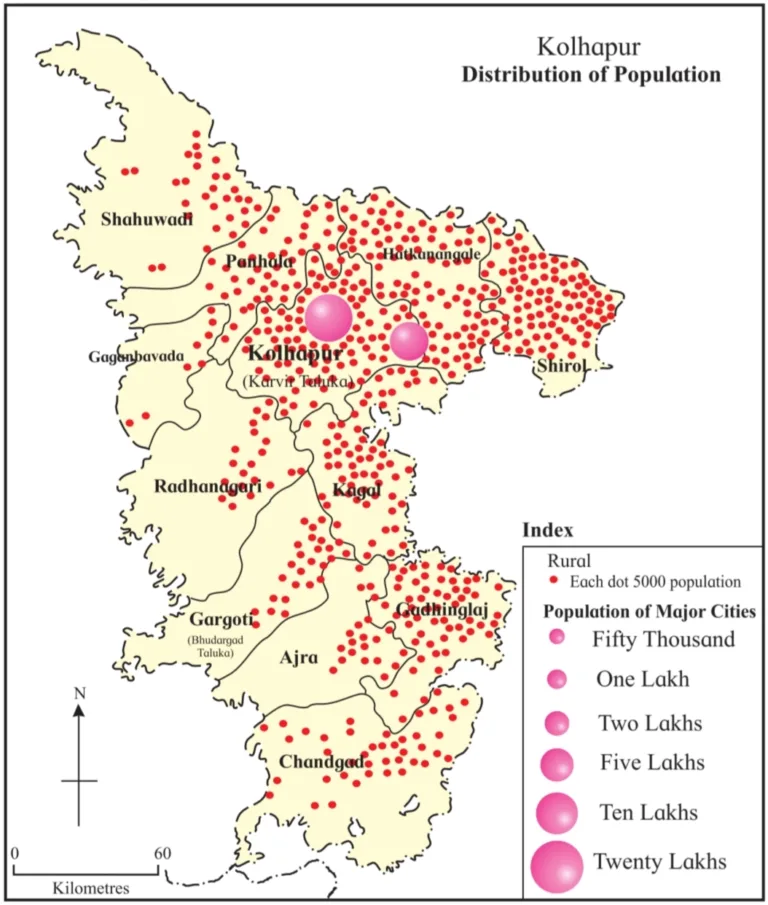
(1) Which method has been used to show the distribution of population in the district?
Ans: The dot method has been used to show the distribution of population in the district.
(2) Explain the direction wise distribution of population from dense to sparse.
Ans: The distribution of population is dense in the Eastern part of the district, whereas the western part of the district has low density of population.
(3) What is the population shown by the largest circle? Which place is that?
Ans: The population shown by the largest circle is nearly 20 lakhs. That place is Kolhapur city (Karvir Taluka).
(4) Which Taluka has the least population?
Ans: Gaganbavada Taluka has the least population.