Part Two
Lesson 15 – Pictographs
Exercise
Study the tables and answer the questions given below.
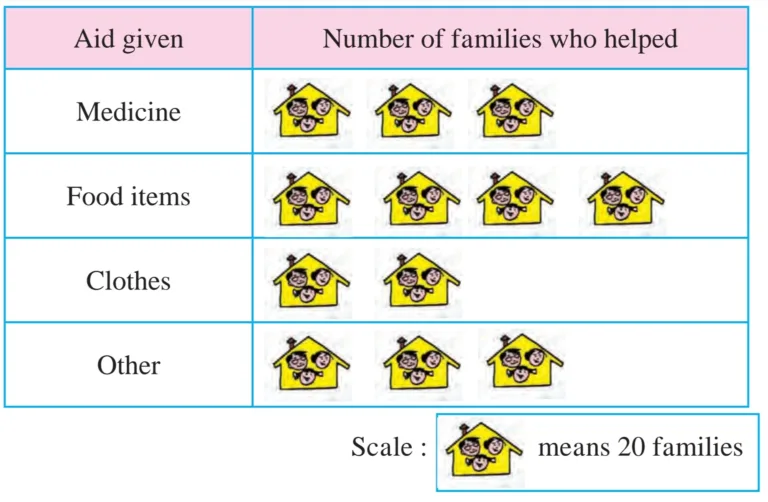
(1) People in a town collected aid for the flood-affected. This is its pictorial representation.

How many families gave medicines as aid?
Ans: 240 families.
What form of help was given by the largest number of families?
Ans: Food items.
What form of aid was given by the least number of families?
Ans: Clothes.
(2) This is a chart showing what kind of fuel is used in the kitchen in 160 houses in a village.

What kind of fuel is used in most houses?
Ans: Kerosene
How many houses use gobar gas?
Ans: 30 houses use gobar gas.
How many houses use gas?
Ans: 40 houses use gas.
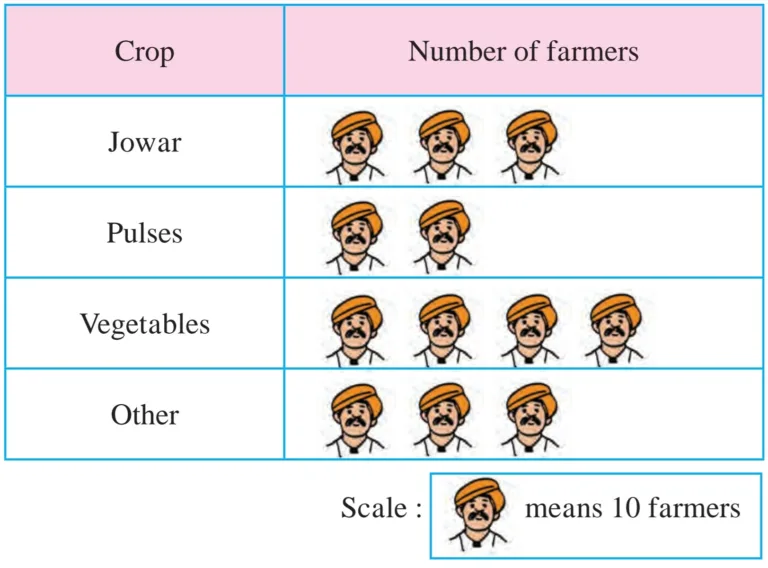
(3) A chart showing the crop grown by the farmers in a village.

How many farmers grow jowar?
Ans: 30 farmers grow jowar.
Which crop is grown by the least number of farmers?
Ans: Pulses are grown by the least number of farmers.
How many more farmers grow vegetables than pulses?
Ans: 20 more farmers grow vegetables than pulses.
(4) A chart showing what colours were worn by children to school on the day when the school uniform was not compulsory.

How many children are there in the class?
Ans: 35 children.
How many children wore yellow clothes?
Ans: 5 children.
What colour did the greatest number of children wear? How many wore that colour?
Ans: Red colour was worn by the greatest number of children. 15 students were that colour.
